StackOverdrive’s service mix offers the setup, initiation, and management of various automated monitors; that ensure that system operations maintain optimal performance. In the event, these monitors track, identify, target, and log active events that can trigger active remedial actions by the user or consultant or simply store requisite passive data points for later investigation or utilization.


Some of the benefits of automated monitoring include:

  • Creation of active metrics associated with data response times, CPU usage, load-balance alarms, exceptions, etc.
  • Establishes end-to-end application performance and stability by identifying and leveraging preventative tasks on-demand
  • Delivers immediate client and/or consultant feedback on the stability of customizations or improvements as required– Reduces systems time and cost while increasing overall process efficiency
  • Establishes and maintains repeatable systems process rules
  • Establishes base, and extended systems provisioning
  • Actively meters all billing activities while directly supporting business revenue analyses

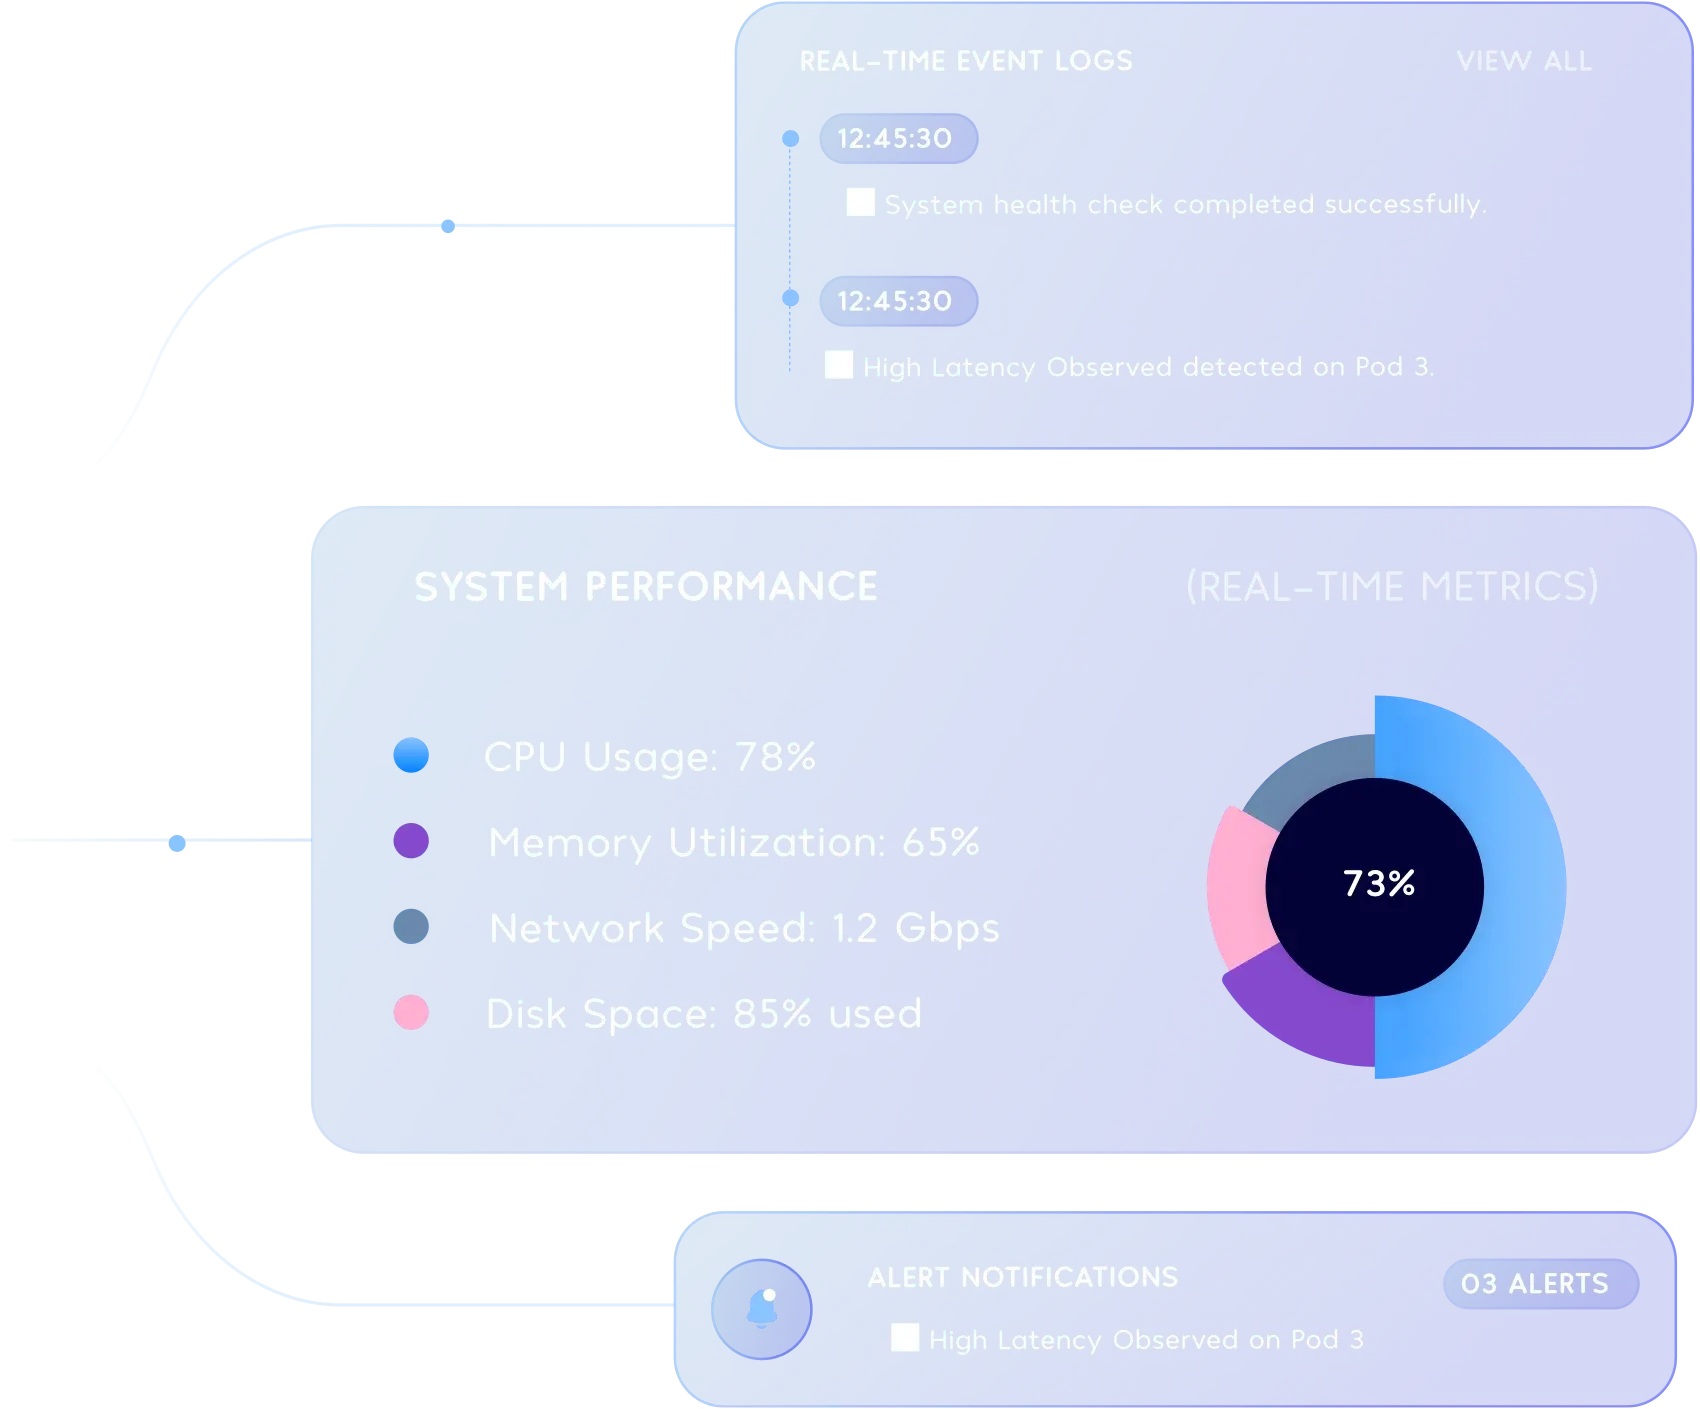
There are several tools available to monitor the performance of your application. Here at StackOverdrive, some of the tools we use are Grafana, New Relic, Datadog, and Sensu to get real-time insights about your software so that we can ensure your application is happy and healthy – 24/7/365.

Grafana

Grafana is an open-source general-purpose dashboard and graph composer web application. It supports Graphite, InfluxDB, Prometheus, or opentsdb as backends.
Learn more about Grafana

New Relic

SaaS tool New Relic helps developers monitor the performance of their web or mobile applications in real time. New Relic is feature-rich and integrates with over 50 services, making sure that you can build, deploy and maintain your software effortlessly. Providing you with information from any part of your software in minutes, New Relic helps you make important decisions based on accurate data on a daily basis.
Learn more about New Relic

Datadog

Datadog is a SaaS monitoring tool that allows you to see metrics from your servers, databases, and applications in an instant. Datadog lets you monitor all your infrastructure in one place by creating monitors that will continuously check the health of your infrastructure. Access everything you need in one dashboard and see the data as it comes in straight from your systems.
Learn more about Datadog

Sensu

Sensu is an open-source monitoring framework designed for cloud environments. Built in Ruby and with configuration done with JSON files, Sensu makes it easy for Configuration Management and other automation tools to create and read them. Collecting and shipping metrics to a variety of tools, Sensu’s robust monitoring and alert system will make sure that you’re notified of any issues before your users are.